The WGEA Gender Equality Scorecard provides an annual update on the state of workplace gender equality in Australia.
The information and data included in 2023-24 Scorecard is based on Gender Equality Reports from 7,414 employers, that reported to WGEA by 31 August 2024.
It offers an insight into the workplaces of 5,169,129 employees across 19 industries in Australia. Of those, 51.1% were women, 48.7% were men and 0.3% identified as non-binary.
Download the full report below
The information employers provided in 2023-24 relates to the year prior to WGEA's publishing of employer gender pay gaps for the first time in February 2024. As such, it reflects what employers were doing in anticipation of the implementation of the legislative change.
While there are still areas for improvement, this Scorecard highlights the impact of the focus and positive action on workplace gender equality in Australia. Employers are making notable progress, especially on analysis of and action to reduce their gender pay gap, employee consultation, parental leave and more comprehensive target setting to deliver results.
These employer actions position Australia well for improvement in workplace gender equality in future years.
Key Insights from 2023-24
Employers are taking greater action on gender equality
Gender equality is clearly on the agenda in Australian workplaces.
90% of employers have a policy or strategy to support gender equality in the workplace.
More employers are seeking to reduce their gender pay gaps and improve gender equality in their organisations, including in workforce composition, parental leave, and employee consultation.
Key areas of action include:
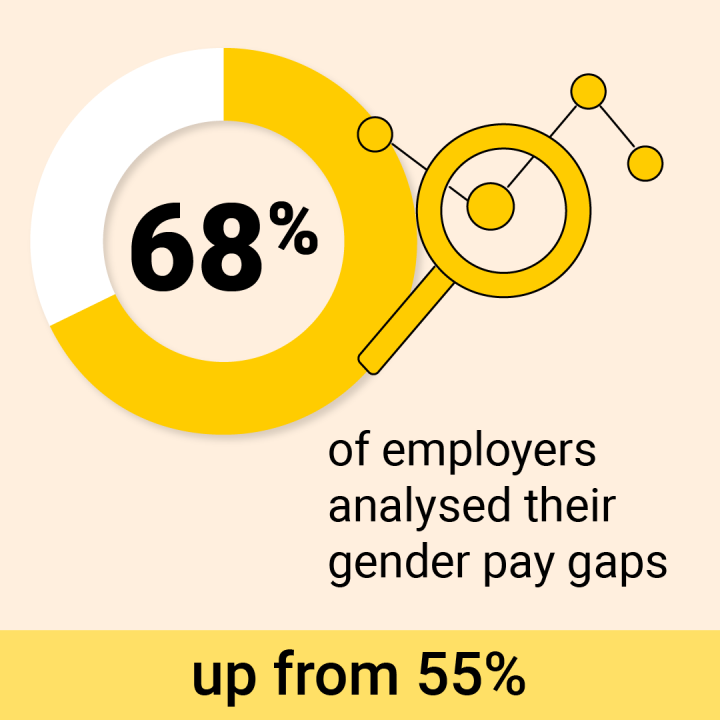
• an increase in the number of employers who have undertaken a gender pay gap analysis, from 55% to 68% year-on-year.
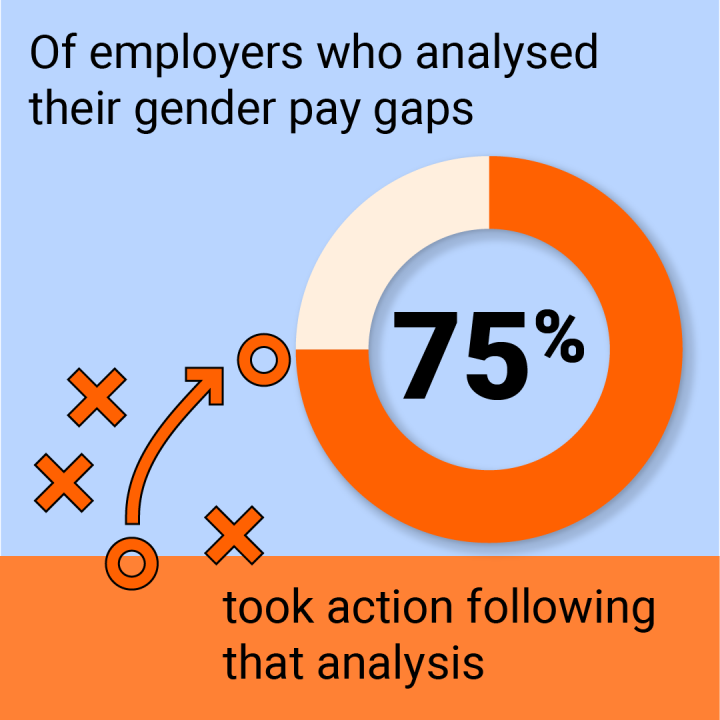
• more employers (75%, up from 60%) are taking action on the results of their gender pay gap analysis.
• of employers who are setting targets (45%), more targets are being set, with the greatest growth in the number of employers that set targets to reduce their gender pay gap (up 17pp to 59%), increasing women in management (up 9pp to 68%) and having a gender balanced governing body (up 11pp to 35%).
The increase in the number of employers conducting a gender pay gap analysis and taking action on the results shows Australian employers are seeking to understand the drivers of their gaps and put in place a plan to address them.
Evidence shows the actions employers are taking, particularly in relation to target setting, will drive improved results in future years.
With a direct link between the unequal division of unpaid care in households and gender inequality in the labour market, equal distribution of caring responsibilities is a key area of opportunity to improve equality.
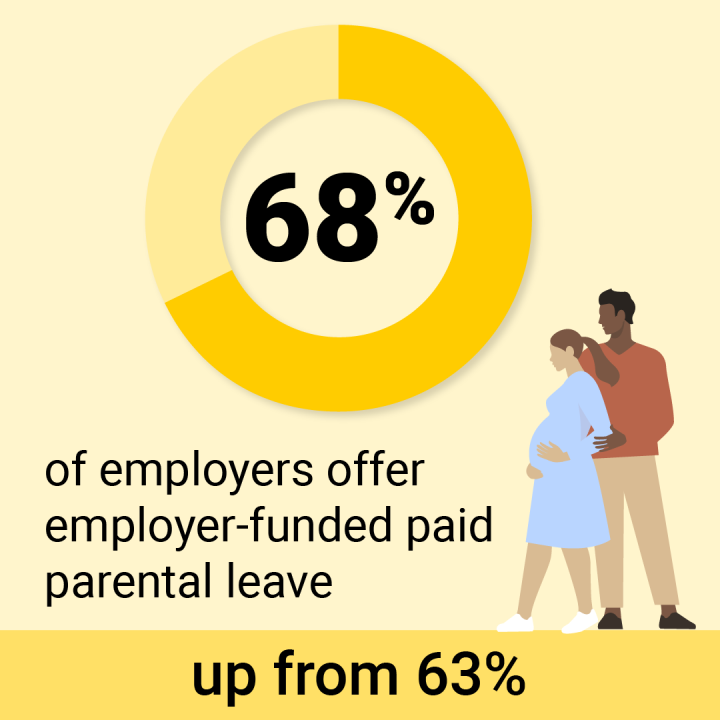
More employers (up 5pp to 68%) are offering paid parental leave, and a greater proportion of parental leave was taken by men (up 3pp to 17%).
Gender-equal uptake of paid parental leave can remove or reduce the stigma more often borne by women for taking time out of the workforce, which can in turn affect their career opportunities. It can also promote shared responsibility for care on an ongoing basis.
Employers are also increasingly discussing gender equality with their employees.
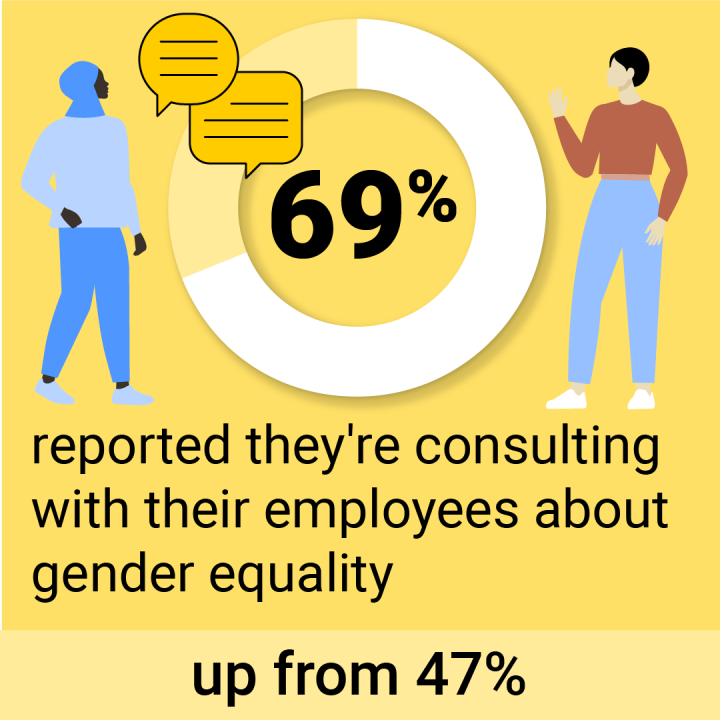
More employers have a policy or strategy for employee consultation on gender equality (up 20pp to 51%) and more employers are consulting employees on gender equality (up 22pp to 69%), enabling them to better understand and address employees’ priorities.
The inclusion of CEO/HOB remuneration data highlights differences at the top
Data consistently shows women’s representation and pay at the level of CEO and HOB is well below that of men.
Women’s under-representation in executive roles also means that they are less likely to be appointed to boards, affecting the ability of the pipeline of candidates to enable gender diversity at board level, both now and into the future.
Employers were required to report CEO, Head of Business (HOB) and Casual Manager remuneration to WGEA for the first time in 2023-24.
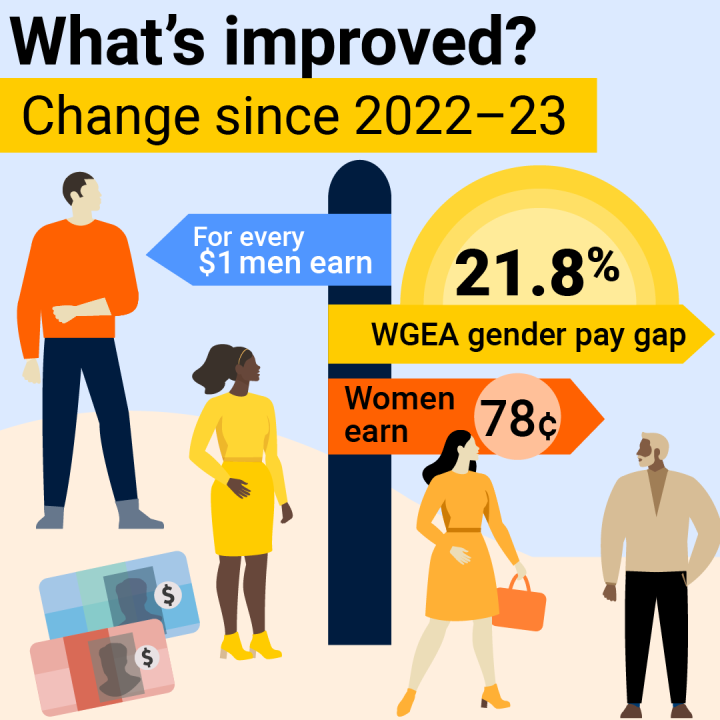
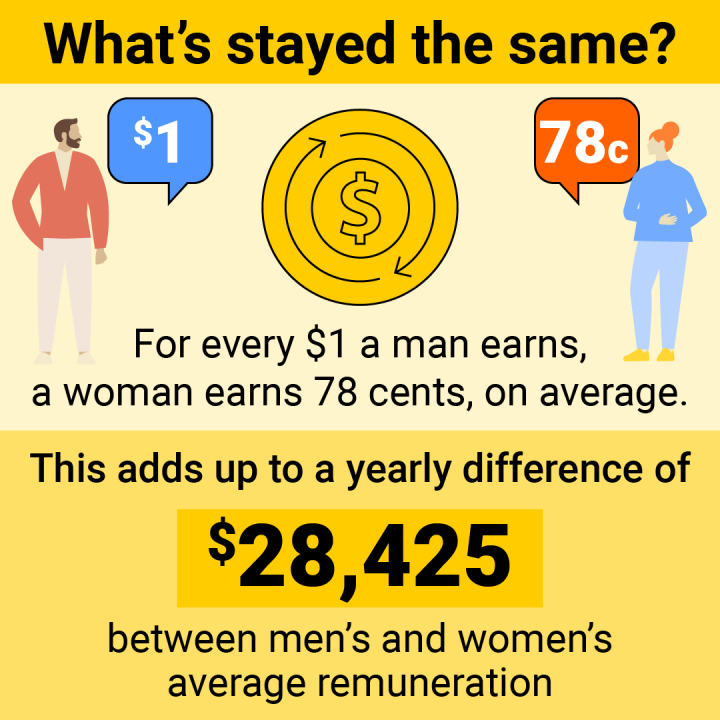
The inclusion of the remuneration of these highly paid, generally masculinised, roles in WGEA’s gender pay gap calculations has resulted in an increase in the average total remuneration gender pay gap of 0.7pp, to 21.8% in 2023-24. This forms a new baseline for WGEA’s national gender pay gap calculations in the future.
The key findings are:
• The CEO/HOB gender pay gap is 27.1%, the largest of all manager categories. Even as women achieve the most senior levels of leadership in organisations, they are paid substantially less than their male peers.
• The higher the manager level, the larger the difference between total remuneration and base salary gender pay gaps, with the largest difference at CEO/HOB, highlighting the role of bonuses and discretionary pay in gender pay gaps at the most senior levels. When looking at base salary, women CEOs are paid $74,923 less per year than their male counterparts. When looking at total remuneration, including bonuses and discretionary pay, the value of this gap increases to $158,632 per year.
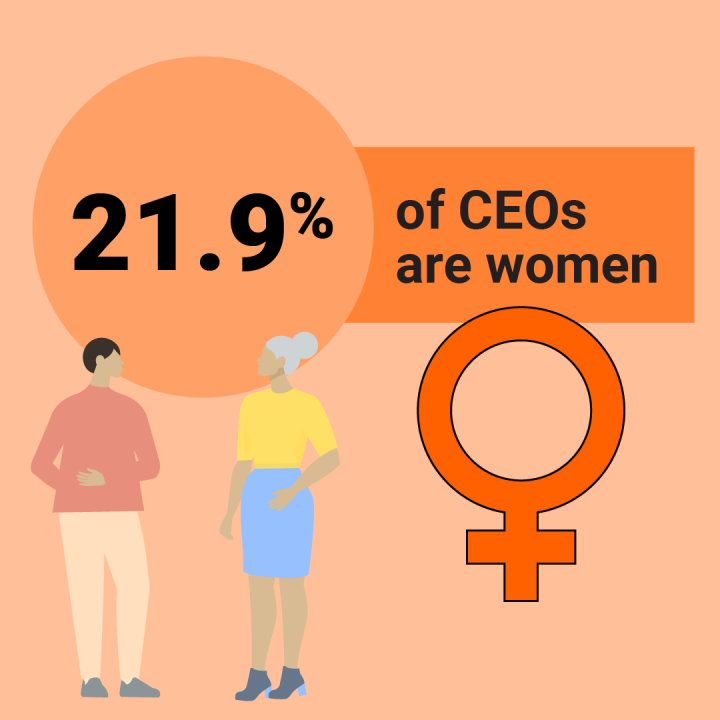
• Only 1 in 4 CEOs/HOBs are women.
• While there are more women CEOs/HOBs in women-dominated industries (44%) than in men-dominated (9%) or gender-balanced (18%) industries, this is still substantially less than their overall representation of 73% in those industries. Further progress is needed in all industries to achieve balanced representation of women at the most senior levels.
Opening more senior leadership roles to women must continue to be a priority for Australian employers.
Employers should seek to understand and address the drivers of significant gender pay gaps at their most senior levels of leadership, and particularly the impact of the unequal distribution of bonuses and other discretionary pay on their gender pay gap.
The gender pay gap reduced, excluding CEO remuneration, due largely to wage movements
In order to undertake a direct comparison of progress on the gender pay gap to last year, a comparison of this year’s result without CEO, HOB and casual manager remuneration is needed.
On that basis, Australia’s average total remuneration gender pay gap marginally declined, to 21.1% in 2023-24, a decrease of 0.6pp from 2022-23.
56% of employers improved their gender pay gap in the past 12 months and the number of employers with a gender pay gap within the target range of 0 +/- 5%, increased from 30% to 31%.
As a result, there was a decrease in the mid-point of employer median gender pay gaps compared to last year from 9.1% to 8.9%.
The main driver of the decrease in the gender pay gap in 2023-24 was the increase of wages for lower paid workers; in particular, Aged Care Residential Services, where women make up approximately 80% of employees, and to a lesser extent, Retail Trade and Accommodation and Food Services.
A secondary driver of the gender pay gap reduction was a greater increase in women manager’s average remuneration (up 5.9% from 2022-23.) compared to men managers (up 4.4% from 2022-23). While composition of the manager workforce has barely changed (remaining at 58% men), a greater wage increase for women narrows the gap between women and men’s remuneration.
There is scope for more focussed action by employers to reduce their gender pay gap, with only 45% of employers setting a target to address gender equality in their workplace and only 59% of them setting a target to reduce the gender pay gap.
Explore the data
The Scorecard is based on data from 7,414 employers covering the workplaces of more than 5 million employees.
Explore the data and information received from employers on a national basis, by industry or by individual employer in WGEA's Data Explorer.
A substantial gap remains
Gendered patterns of remuneration at a national level and differences in workforce composition and remuneration between industries are two key drivers fuelling the size of Australia’s gender pay gap.
When looking at the pay quartiles of the highest and lowest earners, we see that the top quartile has the greatest impact on the gender pay gap: men are much more likely to be in that top quartile and the remuneration of those highly paid men is generally greater than the remuneration of highly paid women.
Conversely, at the lowest quartile, remuneration of women and men is relatively similar, with a lower limit set by the national minimum wage. However, women are far more likely than men to be in the lowest quartile of earners. It is important to note that all industries have a contributing effect.
Each of the industry types makes a significant contribution to the gender pay gap through:
• Men-dominated industries (e.g. Mining and Construction) are highly remunerated and have a low proportion of women.
• Women-dominated industries (e.g. Health Care and Social Assistance), with a lower average remuneration compared to the overall average, bring down the average remuneration of women across the workforce.
• Some gender-balanced industries still have large differences in remuneration between women and men within the industry (e.g. Professional, Scientific and Technical Services and Financial and Insurance Services).
These drivers of the gender pay gap demonstrate that employers need to address both gender composition in the workplace, and remuneration and the value assigned to work in order to reduce their own gender pay gaps, as well as on a national level.
Industry gender-segregation continues to drive patterns of inequality
20% of the gender pay gap can be attributed to industrial gender segregation, according to WGEA’s report with KPMG and the Diversity Council, She’s Price(d)less.
Despite the negative effects of industry gender segregation, WGEA’s 2023-24 Employer Census shows it stubbornly persists.
27% of employees work in 2 women-dominated industries – Education and Training, and Health Care and Social Assistance – an increase of 1pp, and the proportion of the workforce working in the 8 men-dominated industries remains the same at 24%. As such, slightly more than half of Australian employees continue to work in industries dominated by one gender.
While all industry types have seen a drop in the mid-point of employer median gender pay gaps this year, the largest improvement has occurred in men-dominated industries, which have the largest mid-point gender pay gap. Employers in men-dominated industries were also more likely to conduct a gender pay gap analysis (75%) and three quarters of those employers took action as a result of the analysis.
The mid-point of employer median gender pay gaps has dropped:
• 0.5pp for women-dominated industries (2.9% to 2.4%)
• 0.9pp for gender-balanced industries (10.0% to 9.1%)
• 1.3pp for men-dominated industries (15.2% to 13.9%).
It is worth noting that average remuneration of women and men in gender-balanced industries still often favours men.
75% of employers in gender-balanced industries have a gender pay gap in favour of men, compared to 82% of employers in men-dominated industries and 52% of employers in women-dominated industries.
These results show that simply having a balance of genders in a workforce is insufficient for workplace gender equality. Instead, occupational segregation within gender-balanced industries can perpetuate the gender pay gap, with unequal distribution between men and women in higher and lower paid jobs.
Employers are taking action to prevent and respond to sexual harassment
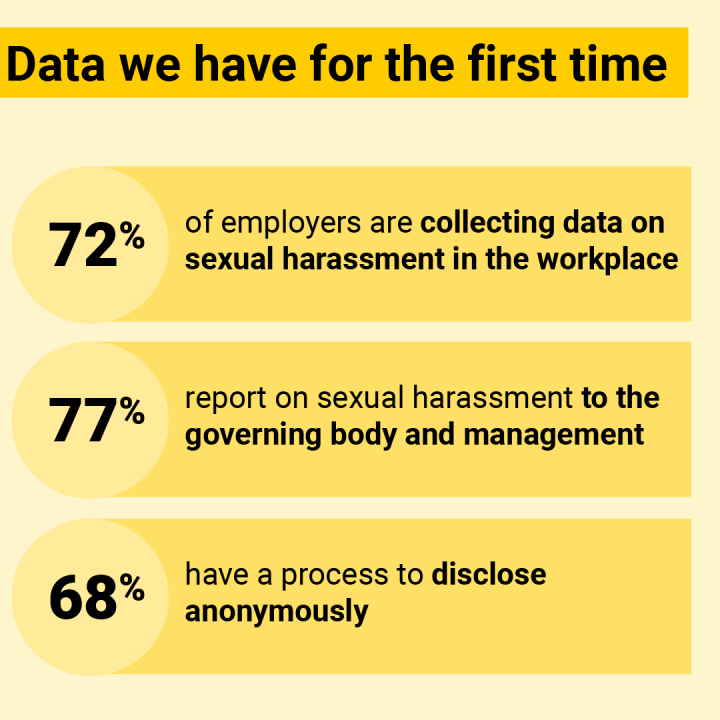
WGEA collected new data on sexual harassment for the first time in 2023-24.
It followed recommendations of the Respect@Work: National Inquiry into Sexual Harassment in Australian Workplaces (Respect@Work) that expanded the information employers report to WGEA on Gender Equality Indicator 6: Sexual harassment, harassment on the ground of sex or discrimination.
The new information provides a comprehensive insight into employers’ engagement with and progress on preventing and responding to work-related sexual harassment.
It suggests that employers are undertaking a range of actions to meet their positive duty to eliminate sexual harassment in the workplace.
While these actions – particularly policy implementation – are fundamental, employers also need to ensure that employees are aware of and understand such policies. Employers must work to prevent, and not just react to, sexual harassment in their workplaces.
There are a number of additional actions employers can take.
These include:
-
regular communications from CEOs on their expectations of safety and respectful and inclusive workplace conduct
-
annual reporting to the CEO and governing body on sexual harassment
-
incorporating discussion of sexual harassment risks and mitigation into employee consultation.
Download the full Scorecard:
The findings in this Scorecard highlight areas where employers and industries are making progress on workplace gender equality, as well as where more work needs to be done to drive change.
We will continue to support and help drive improvement across all gender equality indicators, and in turn accelerate improvement in workplace gender equality.
To read the full report and see the employer results against each of the Gender Equality Indicators, download the report below:
What can employers do?
The findings in this Scorecard point to areas for employer action, progress, and positive change.
The Scorecard can serve as a comparison for an employer with their organisation’s or industry’s data to understand how their progress may differ or align with national trends in order to make a data-informed assessment on where they are stuck and what can be done about it. Employers can use the data in this Scorecard to begin the hard work, take more effective and ambitious action, and make workplace gender equality a priority.
Download past Gender Equality Scorecards
2022-23 Gender Equality Scorecard
2021-22 Gender Equality Scorecard
2020-2021 Gender Equality Scorecard
2019-2020 Gender Equality Scorecard
2018-2019 Gender Equality Scorecard
2017-2018 Gender Equality Scorecard
2016-2017 Gender Equality Scorecard
2015-2016 Gender Equality Scorecard
2014-2015 Gender Equality Scorecard
Keep the conversation going
Compare your results to other employers and industries with the WGEA Data Explorer.
Gender equality is good for business. Find out how you can take action in your business starting today.
These employers lead the way on workplace gender equality in Australia. Find out why.
